


10 Financial Metrics and KPIs Every Leader Should Know to Drive Business Success

Running a business on instinct alone is a short road. The leaders who build durable, profitable companies are the ones who understand what their numbers are telling them — not as an accounting exercise, but as a management instrument. Financial metrics and key performance indicators translate the complexity of a business into a handful of figures that reveal how it is really performing, where the pressure is building, and whether the strategy is working. This guide sets out the ten financial metrics every leader should know: what each one is, how to calculate it, what it actually tells you, and how to act on it.
You do not need to be an accountant to use these. You do need to understand what each measures and why it matters, because the value is not in producing the number but in the decisions you make from it.
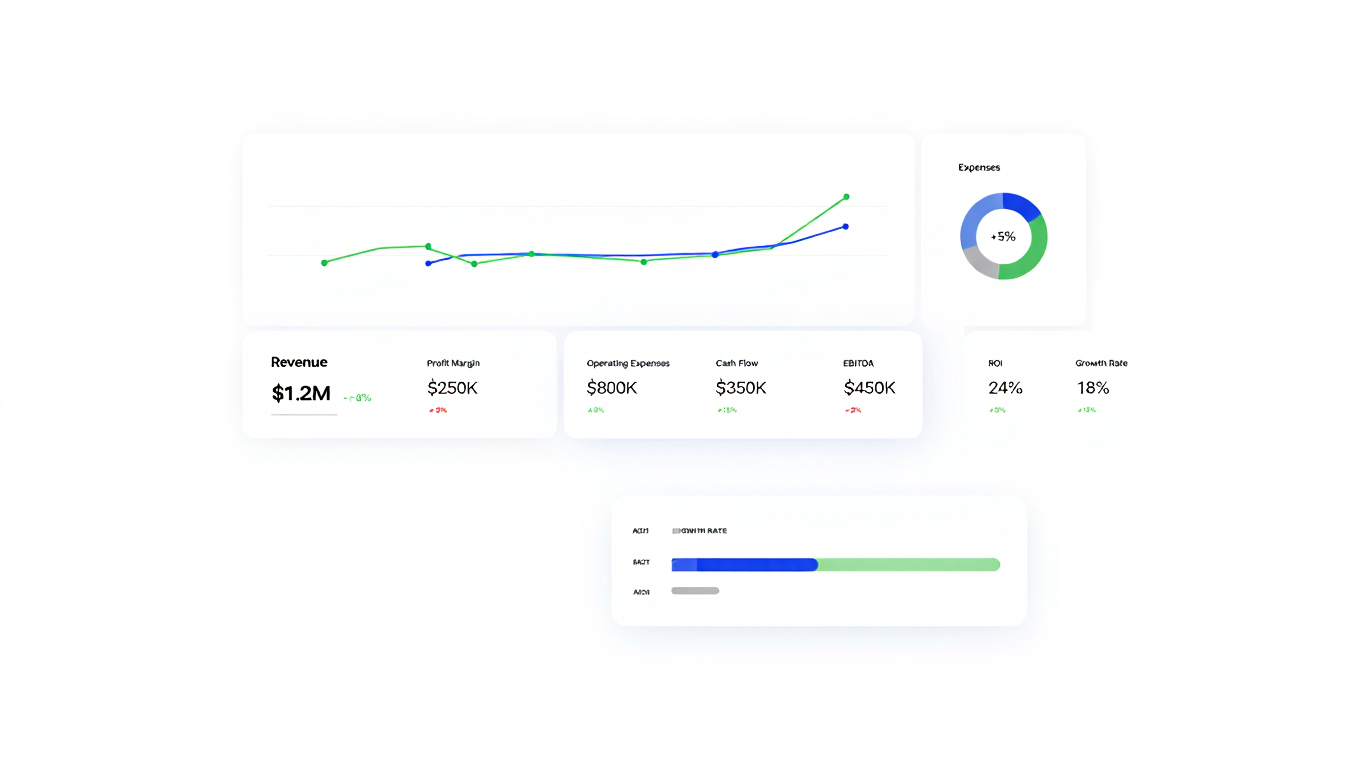
Before taking each in turn, here is the whole set at a glance — the ten metrics, how each is calculated, and what each is really telling you. The rest of this guide expands on each in turn.
| Metric | How it’s calculated | What it tells a leader |
|---|---|---|
| Revenue growth | (This period − last period) ÷ last period | Momentum |
| Gross profit margin | (Revenue − COGS) ÷ revenue | Core product economics |
| Net profit margin | Net profit ÷ revenue | Whole-business profitability |
| Operating cash flow | Cash from normal trading activities | Does the business generate cash? |
| EBITDA | Operating profit + depreciation + amortisation | Underlying operating performance |
| ROI | Net return ÷ cost of investment | Return on money committed |
| CAC | Sales & marketing spend ÷ new customers | Cost to win a customer |
| CLV | Spend × frequency × lifespan × margin | Value of a customer relationship |
| Debt-to-equity | Total liabilities ÷ shareholders’ equity | Financial leverage / risk |
| Current ratio | Current assets ÷ current liabilities | Short-term liquidity |
1. Revenue growth
Revenue growth measures the rate at which your sales are increasing over a period — month on month, quarter on quarter, or year on year. You calculate it by taking the current period’s revenue, subtracting the prior period’s, dividing by the prior period, and expressing the result as a percentage. It is the most visible sign of momentum, and it is usually the first number an investor, lender or acquirer looks at, because sustained growth signals a business that is winning in its market.
But revenue growth on its own can mislead, which is why it sits first among ten rather than alone. Growth bought at the cost of collapsing margins or unsustainable cash burn is not the good news it appears. The leader’s job is to read revenue growth alongside profitability and cash — strong, profitable, cash-generative growth is the goal, and growth that fails any of those tests needs investigating. Where growth is slowing, the causes are usually market saturation, intensifying competition, or a weakening economy; where you want to accelerate it, the levers are typically new products, new markets or segments, better customer retention, and sharper sales and marketing. Track the trend, not just the latest figure, because the direction tells you more than any single period.
2. Gross profit margin
Gross profit margin is revenue minus the cost of goods sold, expressed as a percentage of revenue. It tells you how much of each pound of sales is left after the direct costs of producing what you sell — and therefore how much is available to cover everything else and still leave a profit. It is one of the purest measures of the fundamental economics of your product or service: a healthy gross margin means the core offering makes money before overheads; a thin one means the business is working hard for little underlying reward.
What counts as a good gross margin varies enormously by industry — a software business may run at 80%+ while a food retailer operates in single or low double digits — so the useful comparison is against your own trend and your sector’s norms rather than an absolute figure. A rising gross margin suggests improving efficiency or pricing power; a falling one is an early warning that costs are creeping up or pricing is under pressure, and it is worth catching early because gross margin erosion flows straight through to the bottom line. The levers are cost management on the production side and pricing discipline on the revenue side, and a leader who watches gross margin closely sees trouble — or opportunity — before it reaches the net result.
3. Net profit margin
Net profit margin is what remains after everything — cost of sales, overheads, interest and tax — expressed as a percentage of revenue. Where gross margin measures the economics of the product, net margin measures the profitability of the whole business, and it is the single clearest answer to the question ‘does this company actually make money, and how much?’ A business can have a strong gross margin and a poor net margin if its overheads, financing costs or tax position are eating the difference.
Net margin is where the operational and the financial meet, which makes it a powerful diagnostic. If gross margin is healthy but net margin is thin, the problem is below the gross line — overheads, structure, or financing — and that is where to look. Like gross margin, it is best judged against your own history and your industry’s benchmarks rather than an absolute standard, since a supermarket and a consultancy live in different worlds. Improving it means either lifting the top line profitably or taking cost out of the layers beneath gross profit, and the discipline of watching it regularly keeps a leader honest about whether growth is translating into actual profit.
4. Operating cash flow
Operating cash flow is the cash a business generates from its normal trading activities, before financing and investing. It matters because profit and cash are not the same thing — a business can be profitable on paper and still run out of money, if its profit is tied up in unpaid invoices or unsold stock. Operating cash flow cuts through the accounting to answer the most fundamental survival question: is the core business actually generating cash?
This is the metric that separates businesses that endure from those that fail unexpectedly, because cash is what pays wages, suppliers and lenders — and it is why experienced finance leaders watch cash flow more closely than almost anything else in a downturn. Positive and growing operating cash flow means the business funds itself; negative or declining cash flow, even alongside reported profits, is a warning that demands immediate attention. The common culprits when cash lags profit are working-capital problems: receivables collected too slowly, payables paid too quickly, or stock sitting too long. A leader who monitors operating cash flow, and understands the working-capital cycle that drives it, has the earliest possible warning of trouble and the clearest picture of genuine financial health.

5. EBITDA
EBITDA — earnings before interest, tax, depreciation and amortisation — strips out the effects of financing, tax and non-cash accounting charges to show the underlying operating profitability of the business. It is calculated by taking operating profit and adding back depreciation and amortisation, and it has become one of the most widely used measures in business precisely because it allows a like-for-like comparison of operating performance between companies with different capital structures, tax positions and asset bases.
For a leader, EBITDA is valuable as a clean read on how well the core operations perform, independent of how the business is financed — and it matters enormously at transaction time, because most business valuations are expressed as a multiple of EBITDA, so every pound of sustainable EBITDA can translate into several pounds of enterprise value. That said, it deserves a health warning: because it excludes interest, tax and the cost of maintaining assets, EBITDA can flatter a business that is in reality straining under debt or heavy capital requirements. It is a powerful measure of operating performance, but it is not a substitute for cash flow or net profit, and the sophisticated leader uses it alongside them rather than in place of them.
6. Return on investment (ROI)
Return on investment measures the gain from an investment relative to its cost, expressed as a percentage: the net return divided by the cost of the investment. It is the discipline of asking, of any use of money — a project, a marketing campaign, a piece of equipment, an acquisition — what did we get back for what we put in? It is one of the most versatile metrics a leader has, because it applies to almost any decision that involves committing resources in the expectation of a return.
Used well, ROI imposes a healthy rigour: it forces every significant spend to justify itself against the return it produces, and it allows different opportunities to be compared on a common basis. Its limitations are worth knowing, though. Simple ROI ignores the time value of money — a return next year is not worth the same as a return in five years — and it does not by itself account for risk, so a high expected ROI on a risky venture is not directly comparable to a lower one on a safe one. The best practice is to use consistent data, adjust for time and risk on larger decisions, and read ROI alongside other measures rather than treating it as a single verdict. As a habit of mind, though — always asking what the return is on what you commit — it is one of the most valuable a leader can build.
7. Customer acquisition cost (CAC)
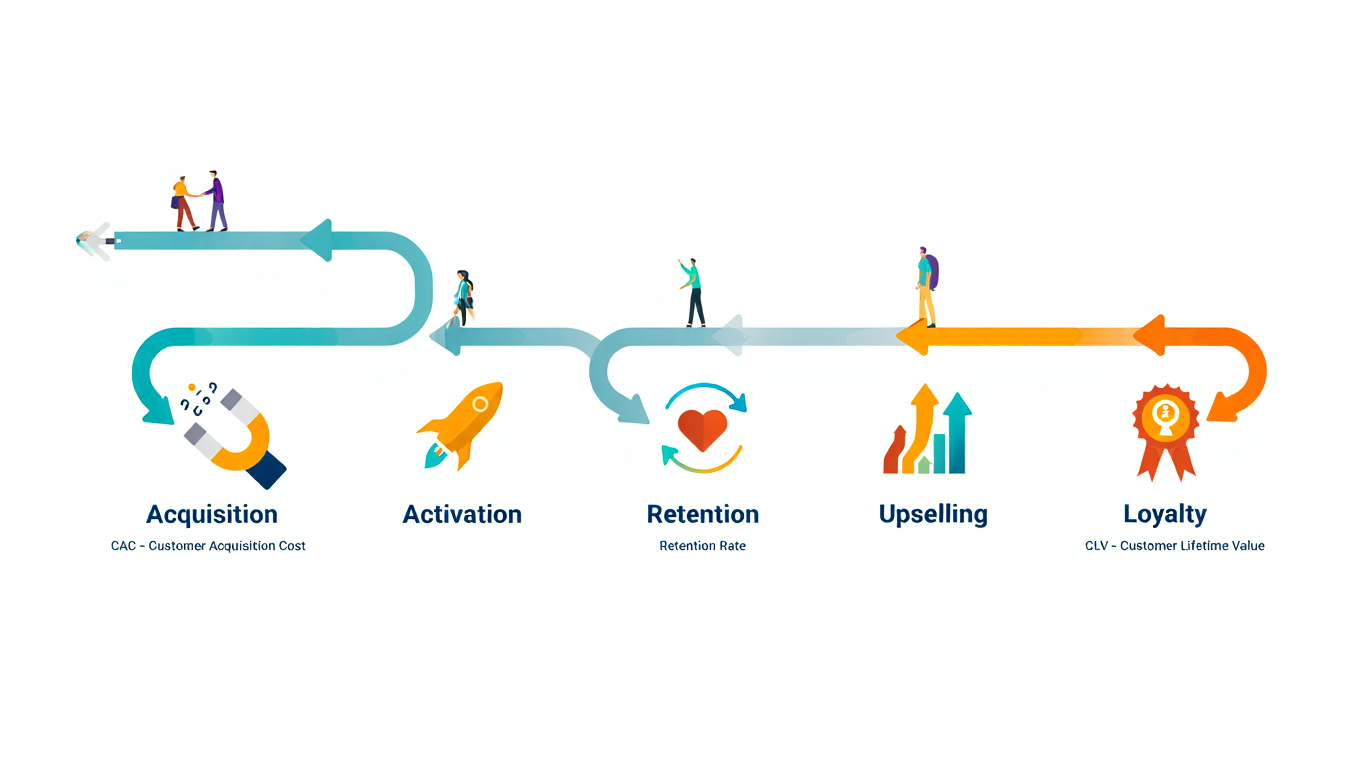
Customer acquisition cost is the total sales and marketing spend required to win a new customer, calculated by dividing that spend over a period by the number of new customers acquired in it. It answers a question that sits at the heart of any growing business: what does it actually cost us to bring in a customer? For any business that acquires customers through marketing and sales — which is most — CAC is fundamental to understanding whether growth is economically sound.
CAC only means something in relation to what a customer is worth, which is why it pairs inseparably with the next metric. A CAC that looks high may be perfectly healthy if customers are valuable and loyal; a CAC that looks low may still be unsustainable if customers churn quickly. The levers for improving it are better targeting so marketing spend reaches the right people, higher conversion so more prospects become customers, and stronger retention so each acquired customer is worth more. A leader who tracks CAC — and, crucially, tracks it against customer value — understands whether the growth engine is creating value or burning it.
8. Customer lifetime value (CLV)
Customer lifetime value estimates the total profit a business can expect from a customer over the whole of their relationship. At its simplest it combines how much a customer spends, how often, for how long, and at what margin, into a single figure for what each customer is worth. It shifts the focus from the one-off transaction to the enduring relationship, which is where most of the value in a business actually sits.
CLV comes into its own when set against CAC, and the ratio between the two is one of the most revealing numbers in any business: if it costs you far less to acquire a customer than that customer is ultimately worth, the growth model is sound and worth investing behind; if the two are close, or CAC exceeds CLV, the model is broken however fast revenue is growing. Improving CLV means deepening relationships — a better customer experience, well-judged upselling and cross-selling, loyalty that reduces churn, and acting on customer feedback. For a leader, understanding CLV reframes the whole question of growth: not simply how many customers you can win, but how much value each relationship creates over its life.
9. Debt-to-equity ratio
The debt-to-equity ratio compares what a business owes to what its owners have invested, calculated by dividing total liabilities by shareholders’ equity. It measures financial leverage — how much the business is funded by borrowing versus by its own capital — and it is one of the clearest indicators of financial risk. A higher ratio means more of the business is funded by debt, which amplifies returns in good times and amplifies pressure in bad ones.
There is no universally right level; what is prudent depends heavily on the industry and the stability of the business’s cash flows. A stable, cash-generative business can comfortably carry more debt than a volatile one, and capital-intensive sectors typically run higher ratios than asset-light ones. What matters for a leader is understanding where the business sits, why, and how sensitive that position is to a change in conditions — because a level of leverage that is comfortable when rates are low and trading is strong can become a serious constraint when either turns. Watching the ratio, and its trend, keeps the financing structure a deliberate choice rather than an accident, and it is an essential discipline in an environment where the cost of debt is no longer negligible.
10. Current ratio
The current ratio measures a business’s ability to meet its short-term obligations, calculated by dividing current assets by current liabilities. It answers a simple, vital question: can the business cover what falls due in the near term with the assets it can readily turn to cash? A ratio comfortably above one indicates the business can meet its short-term commitments; a ratio below one is a signal of potential liquidity pressure that warrants attention.
As with the others, context matters — an unusually high current ratio can indicate cash or stock sitting idle rather than being put to work, so higher is not automatically better, and the ideal range varies by business model. The current ratio is a first-glance liquidity check rather than a complete picture; it is best read alongside operating cash flow and the underlying working-capital dynamics for a full view of short-term financial health. For a leader, it is a quick and valuable gauge of resilience — a fast read on whether the business has the near-term financial room to absorb a shock or seize an opportunity, which is exactly the kind of resilience that matters most when conditions are uncertain.
Common mistakes leaders make with metrics
Knowing the ten metrics is one thing; using them well is another, and there are a few recurring mistakes worth naming so you can avoid them. The first is watching one number to the exclusion of the rest — usually revenue — and missing the story the others are telling, exactly as the worked example above showed. A dashboard exists so that no single metric can mislead you; using it as a single-metric habit defeats the point.
The second is confusing profit with cash. It is one of the most common and most dangerous errors in business, because a profitable-looking business can fail for want of cash, and a leader who does not watch operating cash flow as closely as profit is exposed to a risk they cannot see. The third is chasing vanity metrics — numbers that feel good but do not drive decisions — over the ones that actually reveal the health of the business. Growth in a metric that does not connect to profit or cash is not automatically progress.
The fourth is measuring without acting: producing a beautiful dashboard, reviewing it dutifully, and then changing nothing in response to what it shows. Metrics have no value unless they inform decisions; the whole purpose is to act on what they reveal. And the fifth is judging numbers without context — reacting to a single figure without reference to the trend, the plan or the sector, and either panicking over normal variation or missing a genuine problem. The antidote to all five is the same: read the metrics together, in context, at a regular cadence, and treat them as a prompt to decide rather than a report to file.
Turning metrics into management
The value of these ten metrics is not in tracking them individually but in reading them together, because each illuminates a different dimension of the business and it is the combination that gives a true picture. Revenue growth shows momentum; gross and net margin show profitability; operating cash flow and EBITDA show whether the business genuinely generates money; ROI disciplines how you spend it; CAC and CLV reveal whether growth creates value; and debt-to-equity and the current ratio show how resilient the financial structure is. Read in isolation, any one can mislead. Read together, they tell you where the business is strong, where it is exposed, and where to act.
The practical discipline is to build these into a regular management rhythm — a dashboard reviewed often enough to catch a developing trend while there is still time to act on it, benchmarked against your own history and your sector. But the numbers are only the beginning. Metrics tell you what is happening; they do not tell you what to do about it, and the gap between the two is exactly where financial leadership earns its value.
Turning a dashboard of metrics into sharper decisions — knowing which number matters most this quarter, what it is really telling you, and what to change — is the work of an experienced finance leader. FD Capital’s CFO recruitment team places these leaders into growing UK businesses, permanent and interim.
The metrics working together: a worked illustration
To see why these ten matter as a set rather than a list, it helps to walk through how they interact in a real management situation. Consider a growing business — the figures below are illustrative, chosen to show the pattern rather than to describe any particular company — and watch how reading the metrics together tells a story no single one could.
Revenue growth looks excellent: up 40% year on year, the number the founder proudly leads with. On its own, that is unambiguously good news. But look at the others alongside it. Gross profit margin has slipped from 55% to 48% over the same period — the business is winning more sales, but each one is less profitable than before, which usually means either discounting to drive the growth or rising input costs that have not been passed on. Net profit margin has fallen further still, from 12% to 6%, telling you that overheads have grown faster than the top line, which is common in a business scaling quickly without tightening its cost structure as it goes.
Now the cash picture. Operating cash flow, despite the reported profit, has turned slightly negative. Read against the strong revenue growth, that points squarely at a working-capital squeeze: the business is funding rapid growth by tying up cash in receivables and stock faster than it is collecting it. The current ratio has drifted from 1.8 to 1.1, confirming that short-term liquidity is tightening. And debt-to-equity has risen as the business has borrowed to fund the expansion, so financial risk is climbing just as cash is getting tighter — a combination that has ended many fast-growing businesses that looked healthy on the revenue line alone.
Then the growth economics. Customer acquisition cost has risen by a third, because the easy customers were won first and each additional one now costs more to acquire. If customer lifetime value has risen too, that may be fine; but if CLV is flat while CAC climbs, the business is paying more to acquire customers who are worth no more — growth that destroys value rather than creating it. EBITDA, meanwhile, may still look reasonable, which is exactly the trap: a business can post acceptable EBITDA while its cash position and unit economics are deteriorating underneath.
No single metric told this story. Revenue growth alone said ‘thriving’. But read together, the ten metrics reveal a business growing fast, at falling margins, with tightening cash, rising leverage and worsening acquisition economics — a business that needs to slow down, fix its margins and working capital, and get its cost base under control before it grows further. That is the difference between measuring and managing, and it is precisely the kind of reading a strong finance leader does instinctively.
Benchmarking and cadence: making the numbers mean something
A metric in isolation is just a number; it becomes management information when you give it context, and context comes from two things — comparison and consistency. Comparison means always reading a figure against something: your own prior periods, so you can see the trend and its direction; your budget or forecast, so you can see whether you are on plan; and your industry’s norms, so you can see whether your performance is strong or weak for your sector. A 10% net margin means nothing until you know whether last year it was 8% or 14%, whether you budgeted for 12%, and whether your competitors run at 6% or 20%. The comparison is where the insight lives.
Consistency means measuring the same things the same way, at a regular cadence, so that the comparisons are valid and the trends are real rather than artefacts of changing definitions. Most businesses benefit from a monthly management review of the core metrics, with a lighter weekly watch on the most cash-critical ones — operating cash flow and the current ratio — when conditions are tight. What matters is that the rhythm is regular enough to catch a developing problem while there is still time to act, and disciplined enough that the numbers can be trusted. A dashboard that is looked at once a quarter, or built on shifting definitions, gives the comfort of measurement without its value.
This is also where the quality of a business’s finance function shows. Producing clean, consistent, timely metrics across a growing business is harder than it sounds — it requires good systems, sound processes and the discipline to maintain them — and a business whose numbers are late, inconsistent or untrusted is flying with a faulty instrument panel. Getting to reliable, regular, well-benchmarked metrics is itself a finance leadership achievement, and it is the foundation on which every decision discussed here rests.
From metrics to decisions
Most businesses can produce these numbers; far fewer act on them well. The difference between a business that merely measures and one that manages is the quality of interpretation — the judgement to see that a dip in gross margin and a rise in CAC together point to a pricing problem, or that strong revenue growth alongside weakening operating cash flow signals a working-capital squeeze coming. That interpretation is what a strong CFO or finance director brings, and it is why growing businesses so often find that the step-change in performance comes not from more data but from the finance leadership to make sense of it.
FD Capital places CFOs and Finance Directors — permanent, interim and fractional — who bring exactly that: the ability to turn a business’s financial metrics into the decisions that drive it forward.
Call 020 3287 9501 or email recruitment@fdcapital.co.uk to discuss the finance leadership that turns your financial metrics into better business decisions.
FD Capital — CFO & Finance Director Recruitment
Fellow of the ICAEW | Placing CFOs and Finance Directors who turn financial data into commercial results for growing UK businesses since 2018. 4,600+ network. 160+ placements. Shortlists in 3–7 working days.
Looking to hire? FD Capital’s CFO recruitment service
FD Capital provides specialist CFO recruitment for UK businesses. Explore our CFO recruitment service or call 020 3287 9501 to discuss a mandate.
Related reading and services
Building dashboards leaders actually use.
Acting on what the margin metrics reveal.
Part-time CFO leadership for growing businesses.
Permanent, interim and fractional CFO appointments.
About the author
Adrian Lawrence FCA is the founder and Managing Director of FD Capital. A Fellow of the Institute of Chartered Accountants in England and Wales and a former listed-company Finance Director, he leads every finance-leadership mandate FD Capital accepts personally. Verify his ICAEW membership.
Call 020 3287 9501 or email recruitment@fdcapital.co.uk.
This article is general information and does not constitute professional advice.
Related posts:
Understanding the Difference Between Cost of Sales vs Cost of Goods Sold: A Comprehensive Guide
September 18, 2024Length of Contracts: Fractional vs Interim Roles
July 4, 2025The leading European Directory - Europages
December 7, 2020COO vs CFO: Understanding the Distinct Roles and Responsibilities
July 25, 2024The Hidden ROI of Hiring Interim Finance Leadership
October 26, 2025Cash vs Ego: The Psychological Traps That Sabotage Financial Decisions
April 6, 2025
Adrian Lawrence FCA is the founder of FD Capital and a Fellow of the Institute of Chartered Accountants in England and Wales (ICAEW). He holds a BSc from Queen Mary College, University of London, and has over 25 years of experience as a Chartered Accountant and finance leader working with private, PE-backed and owner-managed businesses across the UK. He founded FD Capital to connect growing businesses with the Finance Directors and CFOs they need to scale — and personally interviews candidates for senior finance appointments.



 Accredited Member of GBC
 Accredited Member of LWF
 Carbon Offset via TreeNation